Disclaimer: This analysis focuses only on inflation. Other macro factors like interest rates, currency movements, and global shocks are intentionally kept out.
While studying Chapter 1 of Alternative Investments (Commodity & Commodity Derivatives) in CFA Level II, I learned something very fundamental:
Gold is used as a store of value and acts as a hedge against the inflation risk of holding currency.
This idea stayed with me.
Around the same time, we were seeing gold prices rise sharply across the world, including in India:
- Current (1 Jan 2026): 24K gold ≈ ₹1,35,050 per 10g
- 1 year ago (end-2024 avg): ≈ ₹1,03,936 per 10g
- 2 years ago (end-2023 avg): ≈ ₹88,278 per 10g
That’s roughly:
- ~30% increase in 1 year
- ~53% increase in 2 years
So the obvious question came to my mind:
If gold works like this, what other assets behave similarly during inflation?
Can we identify them objectively and use them for diversification?
How I approached this question
Instead of relying on opinions, I tried to quantify the relationship.
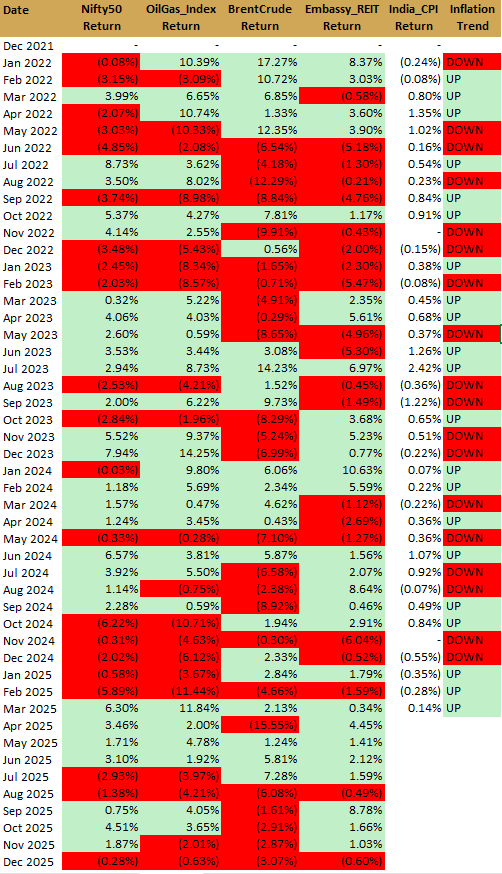
I analyzed monthly returns of the following assets in India:
- Equities: Nifty 50
- Commodities:
- Oil & Gas Index
- Brent Crude
- Real Assets: Embassy REIT
- Inflation: India CPI (monthly change)
The idea was simple:
Do asset returns actually move with inflation trends, or is that just a theoretical assumption?
Inflation as an indicator — theory vs reality
In the curriculum, inflation is often discussed as an important macro variable.
But it is also well known that inflation is a lagging indicator.
My data supported this very clearly.
When I compared monthly asset returns with inflation trend (UP / DOWN), I found that:
- Assets do not move consistently in the same direction as inflation
- There is not a exact clean month-to-month relationship
- Sometimes inflation rises and assets fall
- Sometimes inflation falls and assets rise
This already tells us that inflation is not a timing signal.
Correlation results: weak and near zero
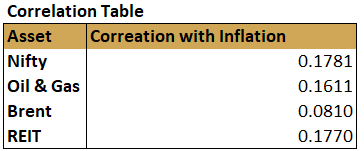
To go one step further, I calculated the correlation between asset returns and inflation returns.
The results suggest that there is no strong positive relationship between these assets and inflation. However, the correlations are slightly above zero, which still provides some insight. As shown below, most assets fall within the range of 0 to 0.2, with the exception of Brent, which shows a correlation of 0.08.
This result may seem counterintuitive, as Brent crude is generally expected to have a higher correlation with inflation. This indicates that other factors are significantly influencing oil prices, most notably geopolitical conditions, which remain one of the most important drivers in the current environment.
So if someone says:
“Inflation affects asset returns directly and strongly”
The data does not support that at a monthly frequency.
This raises a natural doubt:
If inflation matters so much, why can’t we clearly quantify its impact on assets?
So when people—researchers, investors, or even textbooks—say that inflation affects asset returns and should be accounted for, the obvious follow-up question is:
how exactly does inflation affect different assets, and can we really quantify it cleanly?
And honestly… the answer is never straightforward.
Oh God—was it ever going to be?
But that’s exactly why this kind of data matters. Not because it gives us perfect answers, but because it shows us what actually happened in the past, how messy reality is, and how inflation shows up in numbers rather than narratives.
So inflation helps us frame the environment, not predict returns.
That doesn’t mean the data is useless.
It means we need to ask a better question.
What happens during inflation “UP” vs “DOWN” regimes?
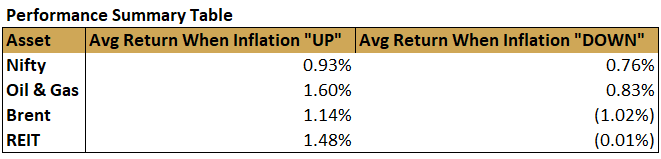
To make this practical, I created a performance summary table.
This table compares:
Average asset returns when inflation is UP vs when inflation is DOWN
The results were interesting:
- Oil & Gas: ~1.60% average return when inflation is UP
- Brent Crude: ~1.14% in UP – positive average returns when inflation is UP, but negative when inflation is DOWN, indicating regime-dependent performance rather than a stable inflation hedge.
- REIT: positive performance during inflation-UP regimes but mixed overall, reflecting sensitivity to both inflation pass-through and interest-rate conditions.
- Nifty: small difference between regimes
This finally gave some structure to the intuition we already have.
As inflation rises:
- Commodity prices tend to rise
- Energy has pricing power
- Cost pressures feed directly into commodity-linked sectors
This explains why commodities appear more relevant in inflationary regimes, even if the relationship is not perfect.
This also helps explain the difference between the correlation results and the regime-based analysis above. Correlation captures how consistently asset returns move with inflation over time and across different conditions, which can dilute the effect of any single factor. In contrast, the regime comparison focuses on average performance during periods when inflation is rising versus falling. As a result, weak correlations do not imply that inflation is irrelevant; rather, they suggest that inflation’s impact is conditional and mixed with other drivers. From a portfolio perspective, this highlights a limitation of relying only on correlation measures, as regime-dependent behavior may still influence outcomes even when linear relationships appear weak.
Why visualization changed my understanding
Numbers are important, but visualization data helped me see patterns that were not obvious from tables alone.
Using charts that overlay:
- Asset monthly returns
- Inflation regime (UP = 1, DOWN = 0)
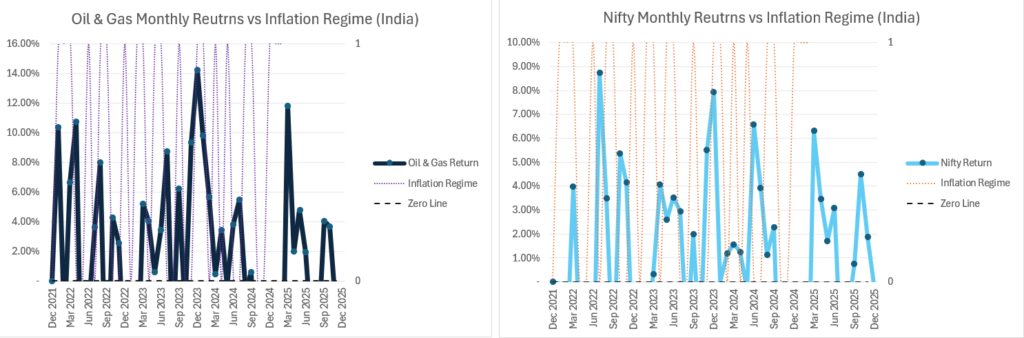
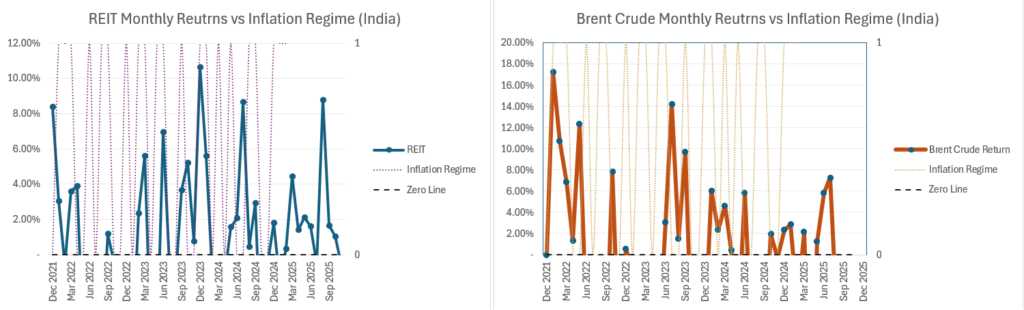
Looking at these charts together, it becomes clear that changes in the inflation regime do not translate into immediate or uniform asset price movements. While sectors such as Oil & Gas show periods where positive returns tend to cluster during inflation-UP phases, REIT and Nifty display more mixed behavior. REIT returns move both up and down across inflation regimes, suggesting that inflation alone does not explain its performance and that other factors continue to play an important role.
Overall, this reinforces that there is no single or straight answer when analyzing the relationship between inflation and asset returns. The insights from this visualization help clarify one part of the picture, but they need to be considered alongside other factors and analyses to form a more complete understanding.
This confirmed what the tables hinted at:
Inflation is a background condition, not a trigger.
So what did I actually learn?
- Inflation is not a leading indicator
- Inflation does not directly predict monthly returns
- There is no single asset (other than gold structurally) that cleanly hedges inflation in the short term
- Commodities show better alignment with inflationary regimes, but not certainty
- Inflation helps more in understanding risk exposure, not in making buy/sell decisions
Gold behaves differently because:
- It is not valued on cash flows
- It responds to real rates and monetary credibility
- It works over long horizons, not month to month
Final thought
This exercise didn’t give me a perfect answer — and that itself is the answer.
Inflation hedging is not about finding one replacement for gold.
It’s about understanding:
- Which assets survive inflationary environments
- Which assets have pricing power
- How much inflation risk your portfolio is already carrying
We can’t eliminate inflation risk — but we can understand it better.
If you want to share your thoughts or interpretations, feel free to comment below.
Thanks for reading.